Data quality in Norwegian nautical charts
Pay attention to the quality information in the nautical charts. The quality of the depth data in the nautical charts is indicated in the chart's ZOC (Zones of Confidence) diagram. The ZOC diagrams in the paper charts correspond to the accuracy indications in official electronic nautical charts (ENCs).
When was the area surveyed?
ZOC chart provides an overview of data quality in the map. Are there "red areas" that have never been surveyed, or perhaps "dark pink areas" that were surveyed by hand?
The ZOC chart helps you consider the limitations that the nautical chart provides. Seafarers must pay extra attention to areas that have not been surveyed or have inaccurate and old data, and consider where it is safe to travel. It is encouraged to navigate with caution in areas with older, low-quality depth surveying.
Data quality in nautical charts is indicated based on the surveying methods (technology) used to map depth. In paper charts, the data quality is shown in a ZOC diagram and in a separate data layer in electronic nautical charts (ENCs).
The Norwegian Mapping Authority has extracted the information about CATZOC from the official ENCs and distributes datasets and WMS services via the national datportal Geonorge. The data layer can be used to get an overview of the data quality of depth data in the navigation products (geonorge.no) along the Norwegian coast and in Svalbard.
ZOC chart in paper charts
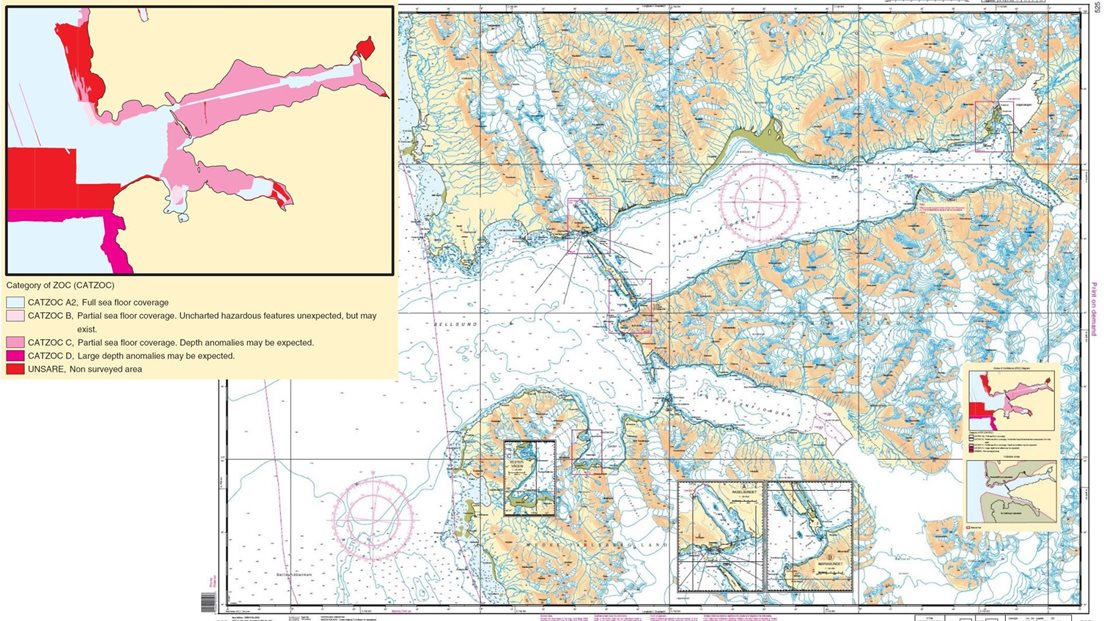
A ZOC diagram has been inserted in Norwegian nautical charts. It is a small overview map that shows the data quality of the depth data in the map.
The quality of the surveying depends on which hydrographic and positioning instruments were used when the seabed was surveyed. Pay extra attention to which areas have poor quality in-depth data. The risk of navigating there is extra high.
A ZOC chart is divided into seven colours:
- Yellow is land area (the same colour as the country tone in the map).
- White area is CATZOC A1: Modern depth surveying with multibeam sonar.
- Blue area is CATZOC A2: Full area search undertaken. Significant seafloor features detected, and depths measured. Modern depth surveying with multibeam sonar classified as slightly lower accuracy than A1.
- Light pink is CATZOC B: Full seafloor coverage not achieved; uncharted features, hazardous to surface navigation are not expected but may exist.
- Mid-pink is CATZOC C: Full area search not achieved; depth anomalies may be expected.
- Dark pink is CATZOC D: Full area search not achieved; large depth anomalies may be expected.
- Red color is UNSARE (Unsurveyed): The area has not been surveyed.

ZOC-diagram: This is what a ZOC-diagram in a paper chart look like. This is taken from main series map no. 525 Bellsund - van Mijenfjorden, which covers waters in Svalbard. Source: The Norwegian Mapping Authority
Data quality in electronic nautical charts (ENC)
In official electronic nautical charts (ENCs), there is a separate data layer that tells what the quality of the depth data is in the area. It is the same assessment that forms the basis as for paper charts as marine surveying and positioning instrument, depth accuracy and degree of coverage.
The data layer is called data quality (M_qual) and is divided into different quality categories, so-called Zones of Confidence (ZOC). There are five different ZOC categories, where A1 is the best and D is the worst. In addition, there is a category U, which shows areas where data quality has not been considered. It is the International Hydrographic Organization (IHO) that regulates the ZOC categories.
Zones of Confidence (ZOC) in Norway and Svalbard
The Norwegian Mapping Authority follows international standards and, based on what we know about surveying methods, positioning instruments, depth accuracy and data coverage in Norwegian waters, has classified our depth data.
Quality categories (CATZOC) in Norwegian ENCs:
- A1: Full area search undertaken. Significant seafloor features detected, and depths measured.
- A2: Full area search undertaken. Significant seafloor features detected, and depths measured. Modern depth surveying with multibeam sonar classified as slightly lower accuracy than A1.
- B: Full seafloor coverage not achieved; uncharted features, hazardous to surface navigation are not expected but may exist.
- C: Full area search not achieved; depth anomalies may be expected.
- D: Full area search not achieved; large depth anomalies may be expected.
- U: Unassessed - The quality of the bathymetric data has not been assessed.

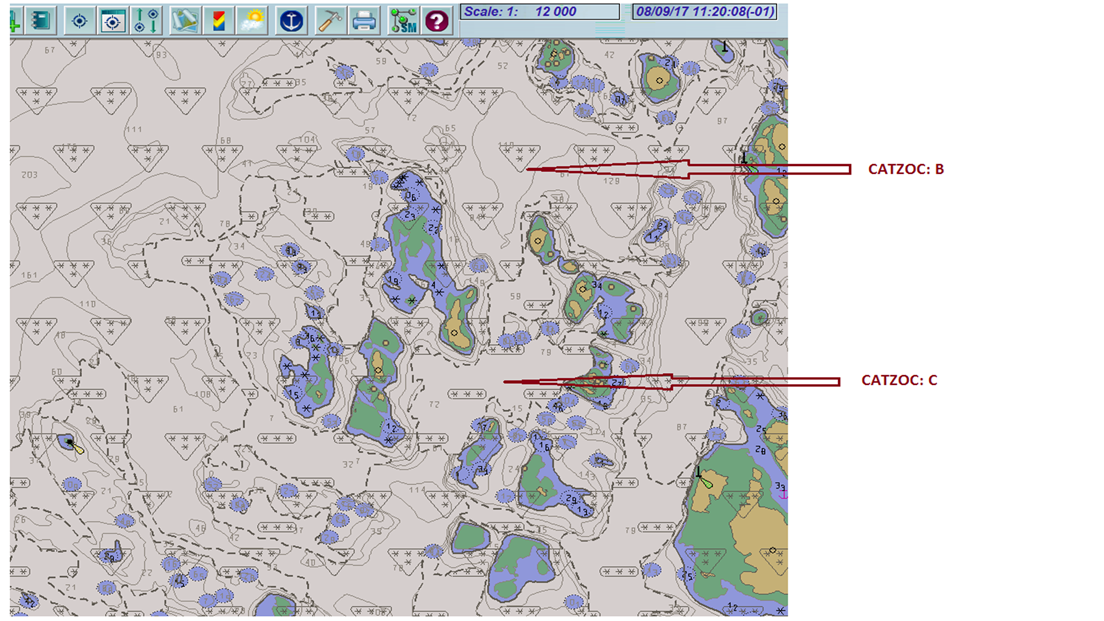
ZOC: This is how the quality of depth data is labelled in Norwegian ENCs is used in the type-approved electronic mapping system ECDIS. Illustration: Screenshot from MARIS
Technology sets the standard
The rapid development in shipping has resulted in larger and deeper vessels. New navigation methods and instruments have been improved and are the reasons why the reliability of nautical charts is more demanding than ever.
The Norwegian Mapping Authority has mapped Norwegian sea areas in depth since the 1800s and has used the most modern surveying methods available at any given time. The reliability of nautical charts is therefore largely dependent on the technology that forms the basis for the depth mapping.
Replacing all the older depth surveys requires time and resources. Therefore, today's nautical charts consist of depth data from different technology periods.

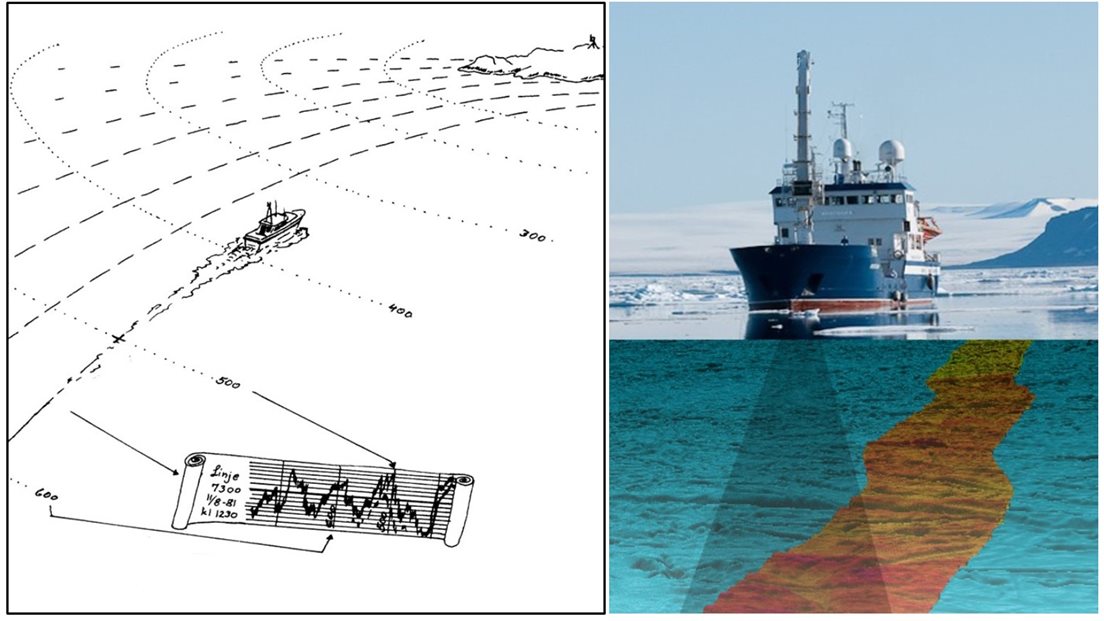
Surveying: Previously, the seabed was surveyed in lines with single-beam echo sounders mounted under the work boat. Now we use multibeam echo sounders, and get area-wide sea surveying. Illustrations: The Norwegian Mapping Authority


The mail has been sent!